Live Auth Monitor
Real-time visualization of account connections and performance across all OAuth providers. The monitor displays a radial diagram showing each account’s status and success rate.Overview
Access the auth monitor from the dashboard Home page:- Dark Theme
- Light Theme
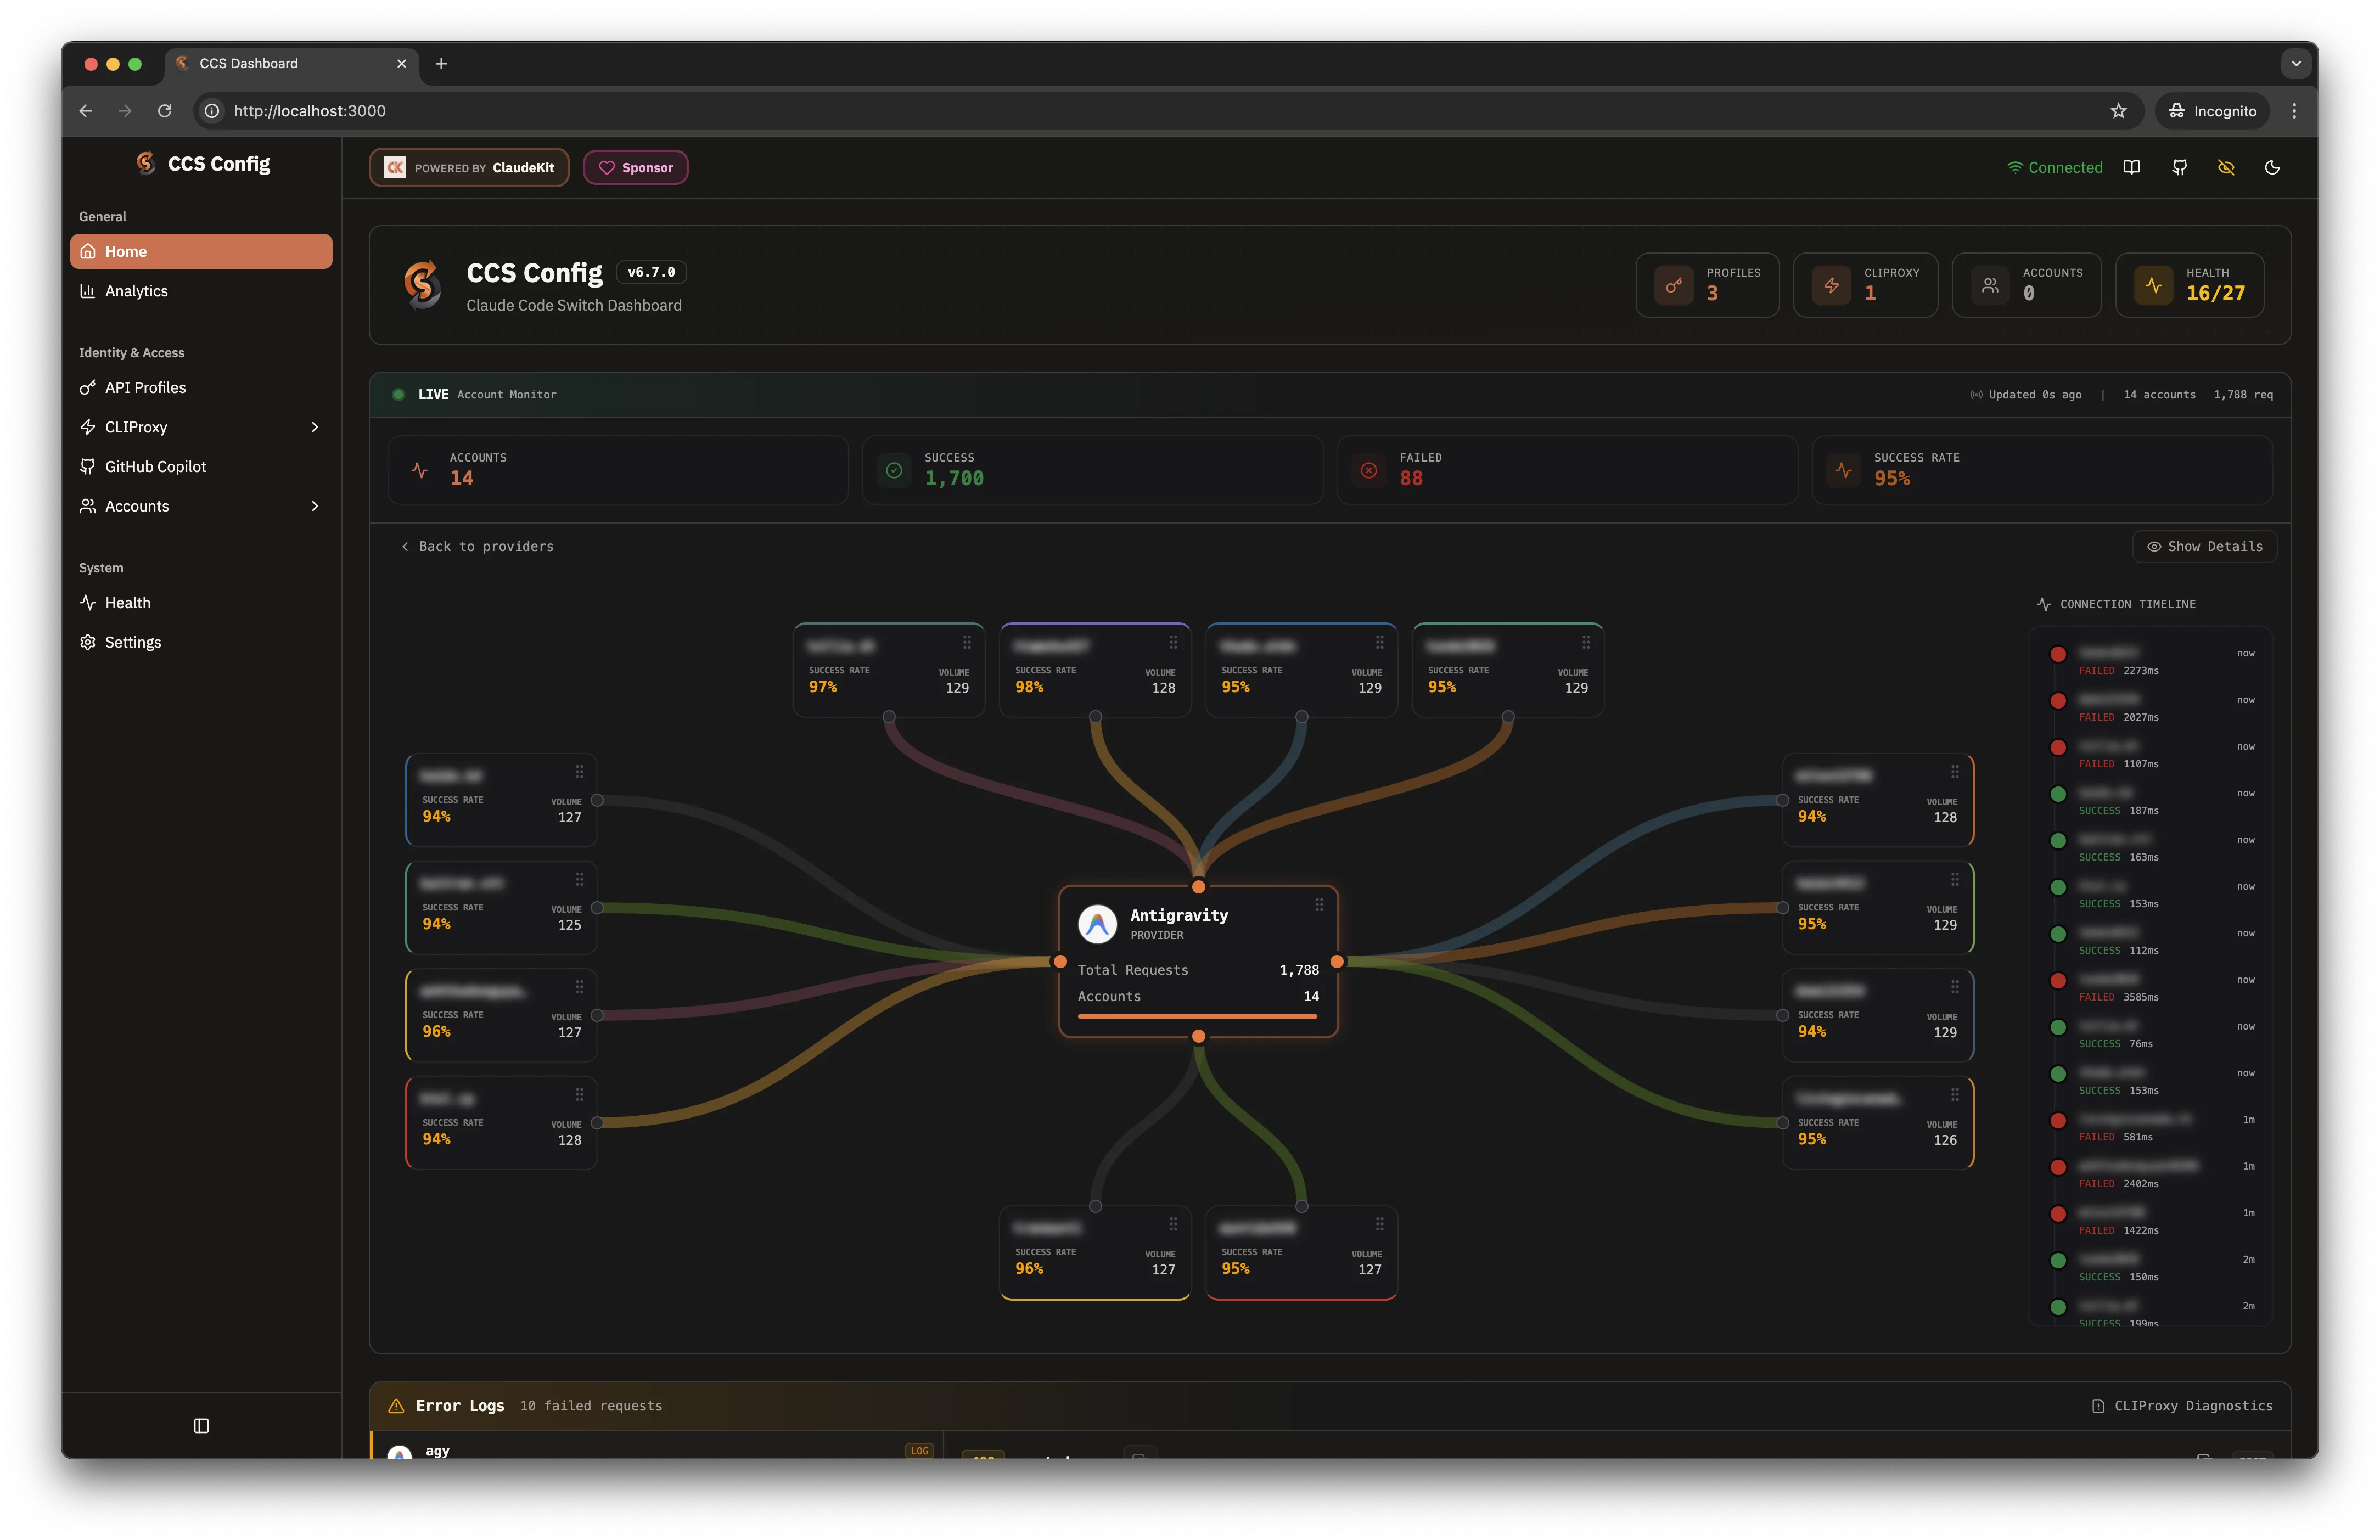
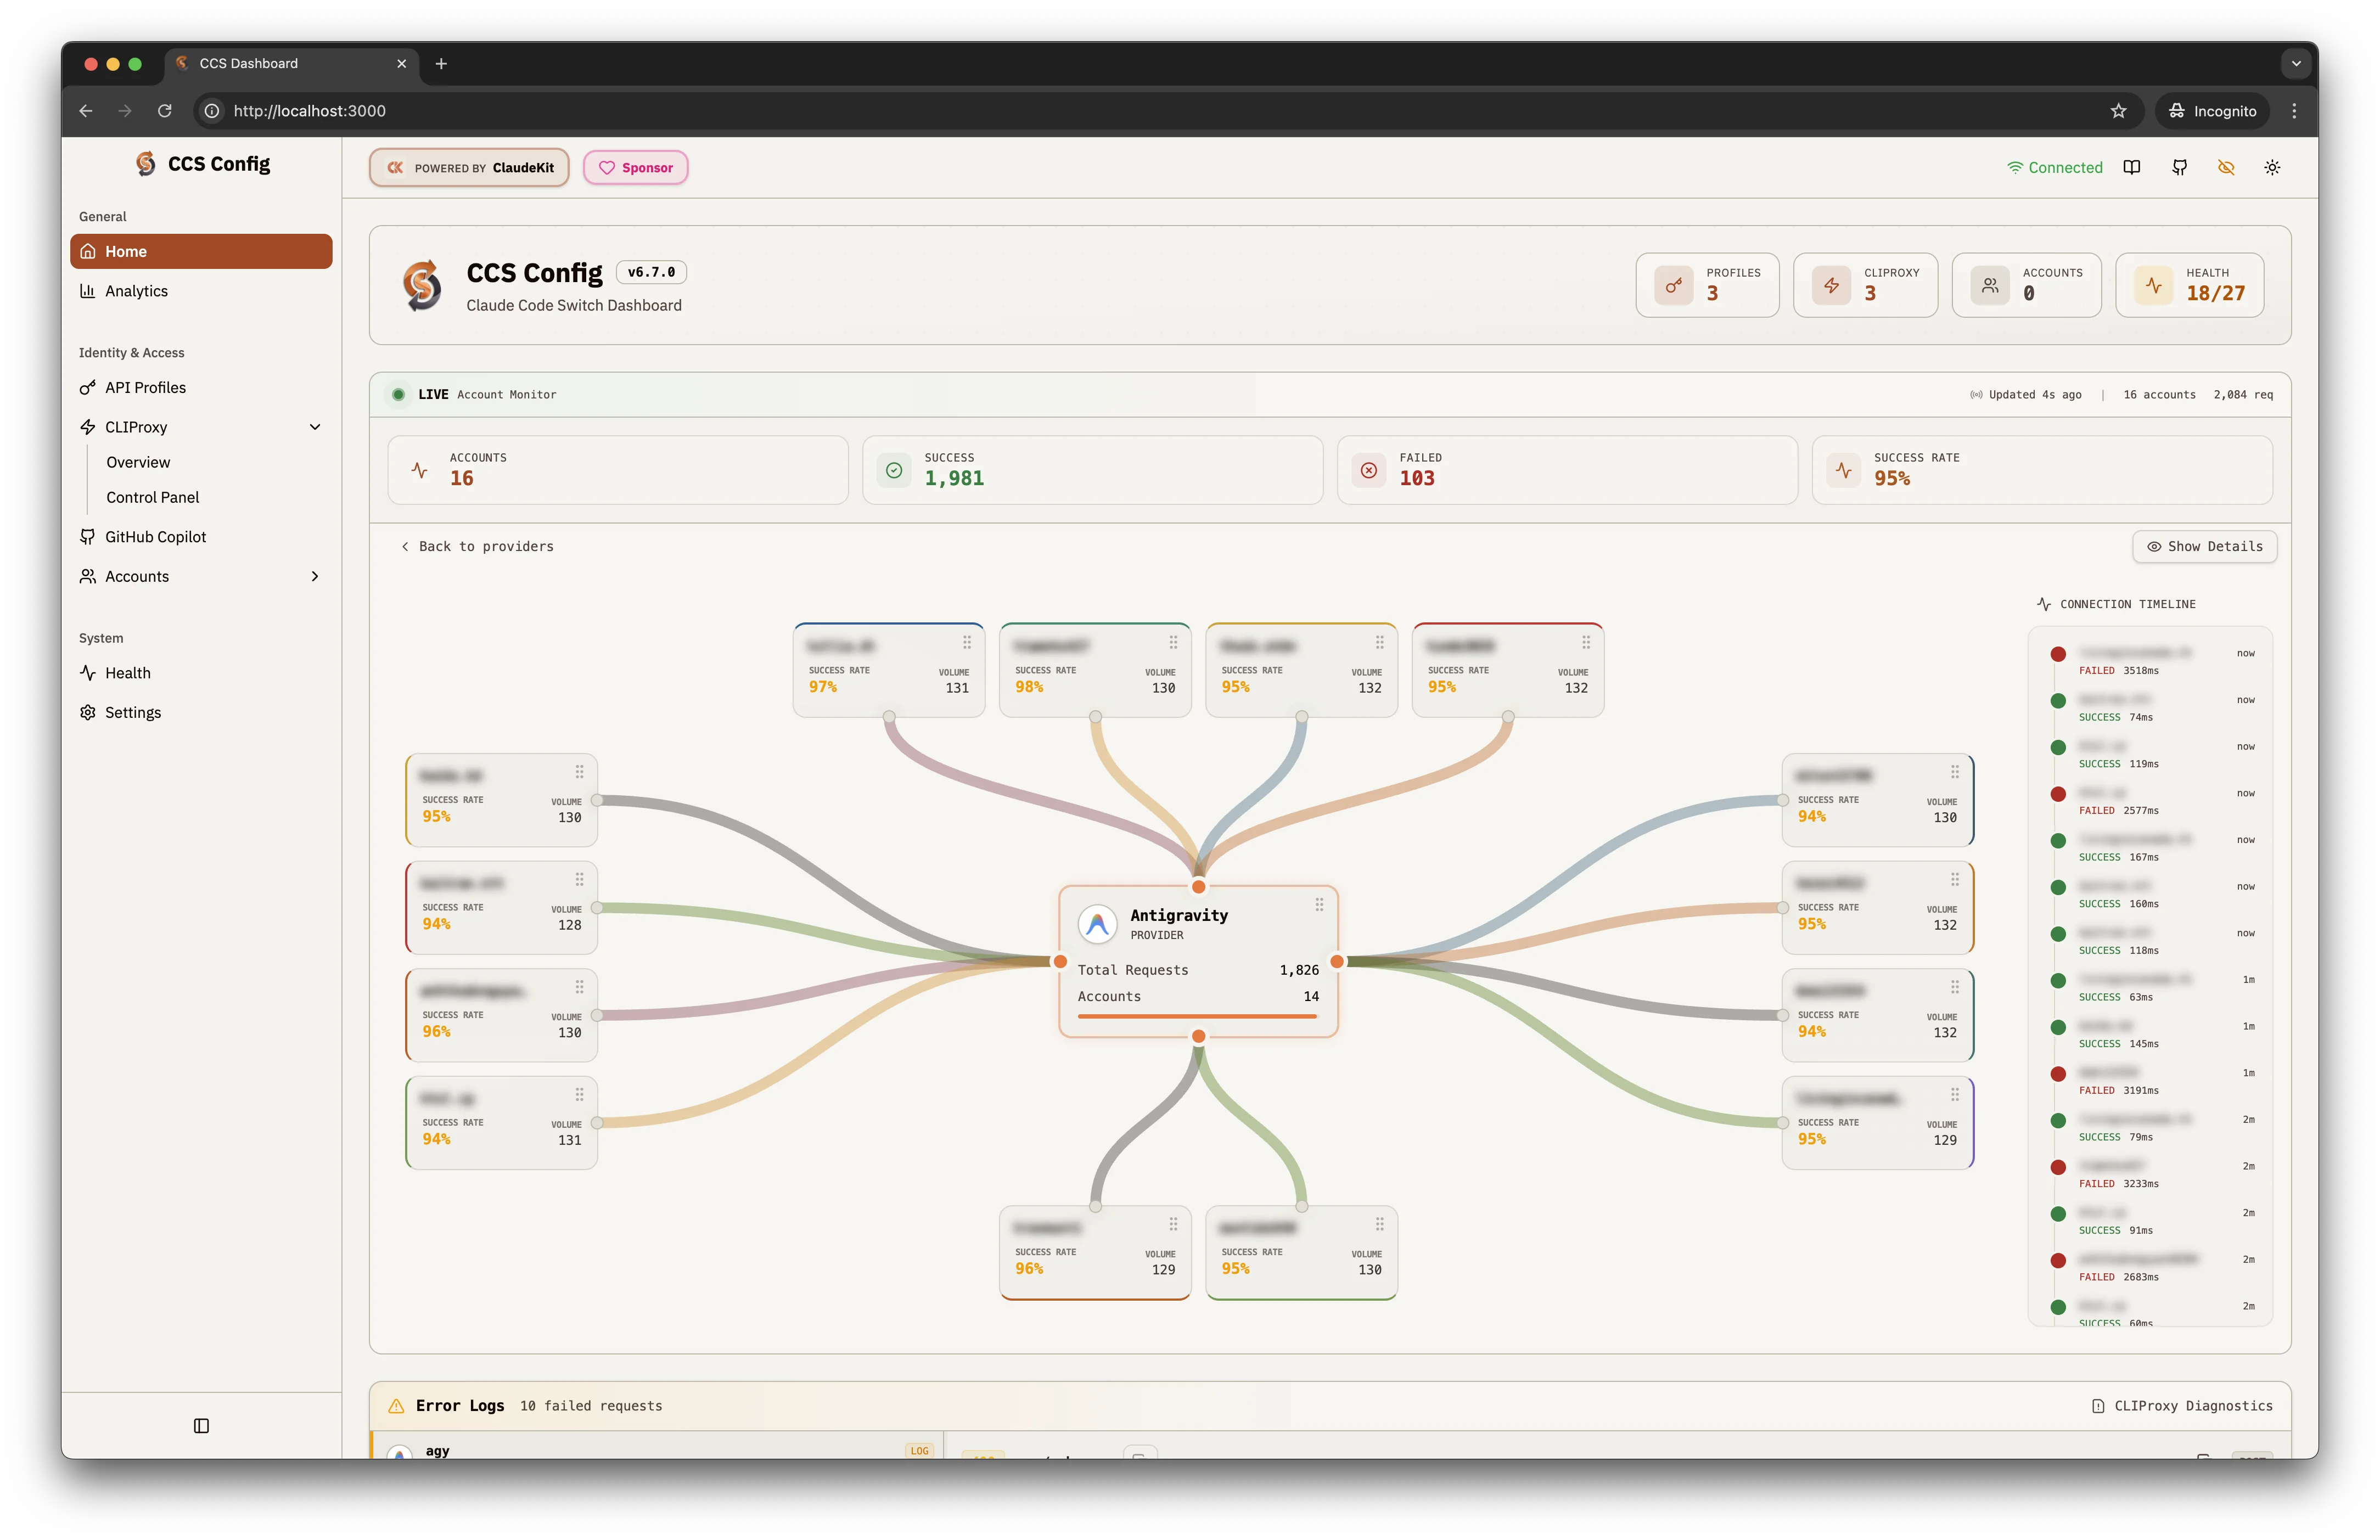
Radial Diagram
The central visualization shows:- Central Node: Provider name with total requests and account count
- Peripheral Nodes: Individual accounts with success rates and request volumes
- Colored Connections: Lines indicating communication status between provider and accounts
Key Performance Indicators
| Metric | Description |
|---|---|
| Accounts | Total connected accounts for the provider |
| Success | Number of successful requests (green) |
| Failed | Number of failed requests (red) |
| Success Rate | Percentage calculated from success/total |
Connection Timeline
Real-time log of recent connection events:- Green dot: Successful request with response time
- Red dot: Failed request with error details
- Timestamps: Relative time (now, 1m, 2m ago)
Status Indicators
Active
Connected and responding normally
Degraded
Elevated error rate or slow responses
Failed
Connection lost or authentication error
Quick Actions
From the monitor interface:- Show Details: Expand account information
- Back to providers: Return to provider list
- Refresh: Force status update
Bottom Diagnostics
| Section | Purpose |
|---|---|
| Error Logs | View failed request details |
| CLIProxy Diagnostics | Service-level debugging |