Analytics Dashboard
The Analytics dashboard provides comprehensive visibility into your AI usage patterns, costs, and performance metrics across all configured providers — including Claude, CLIProxy OAuth providers, and CLIProxy multi-provider sources.Overview
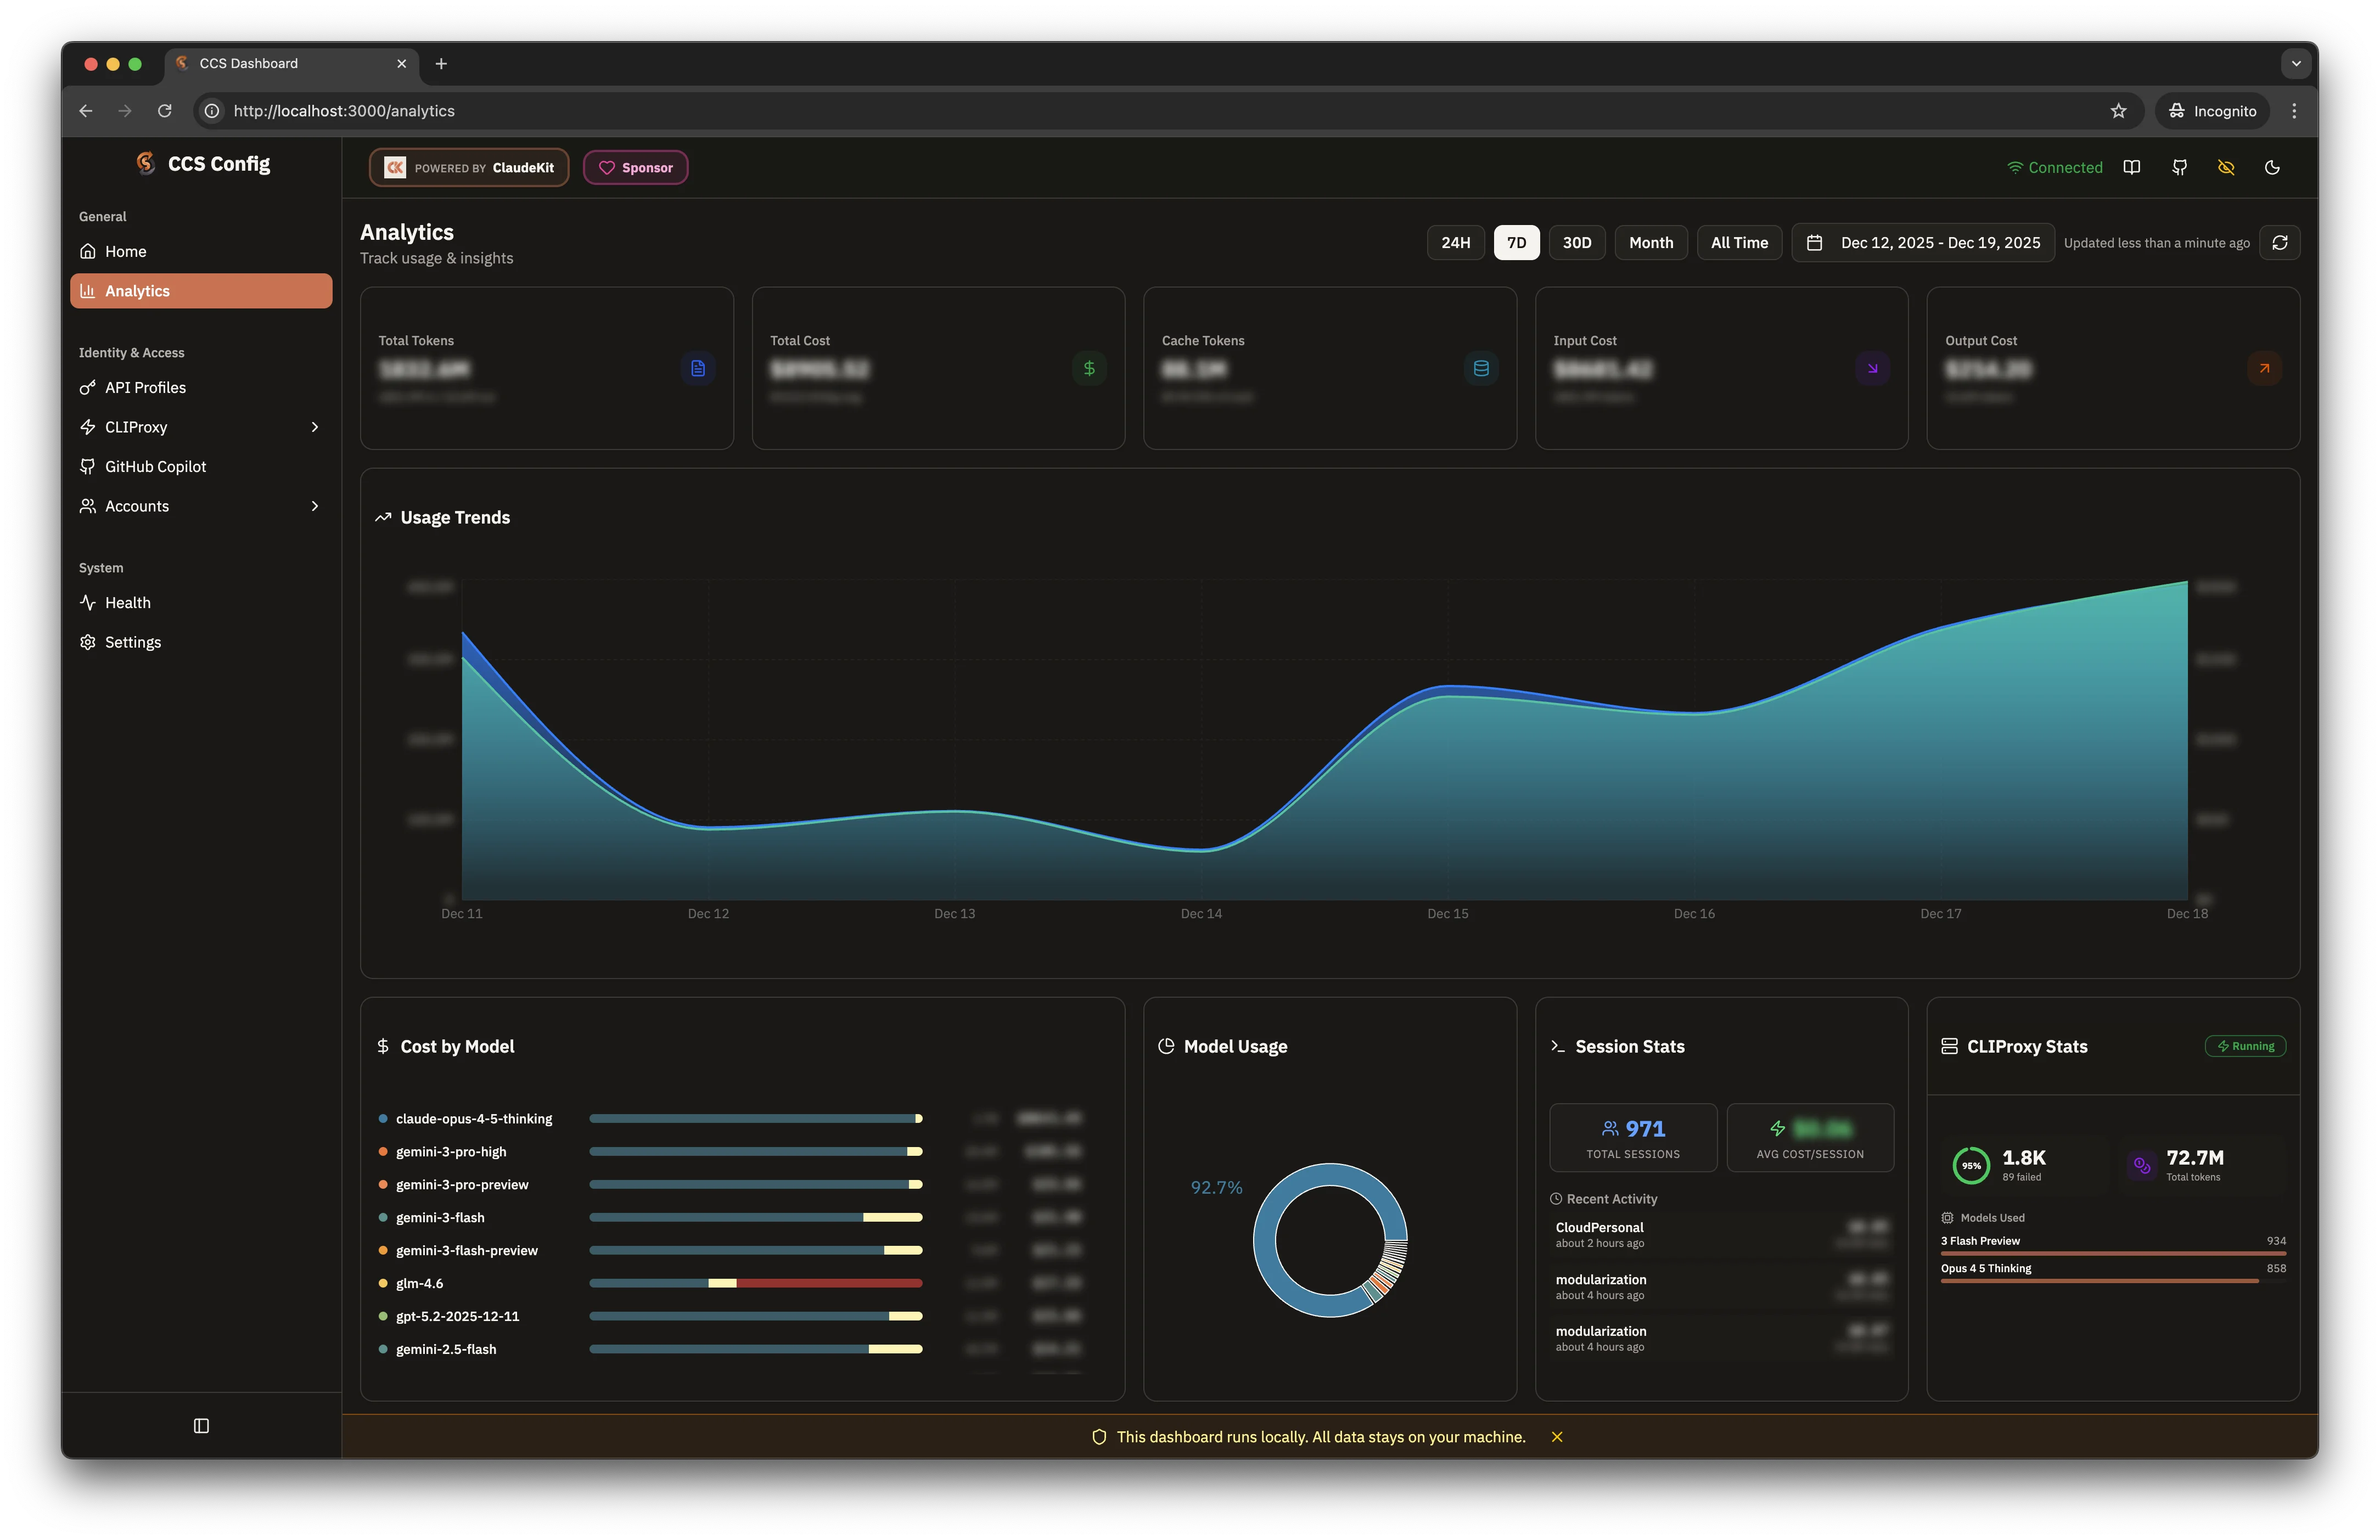
Access analytics through the dashboard:- Dark Theme
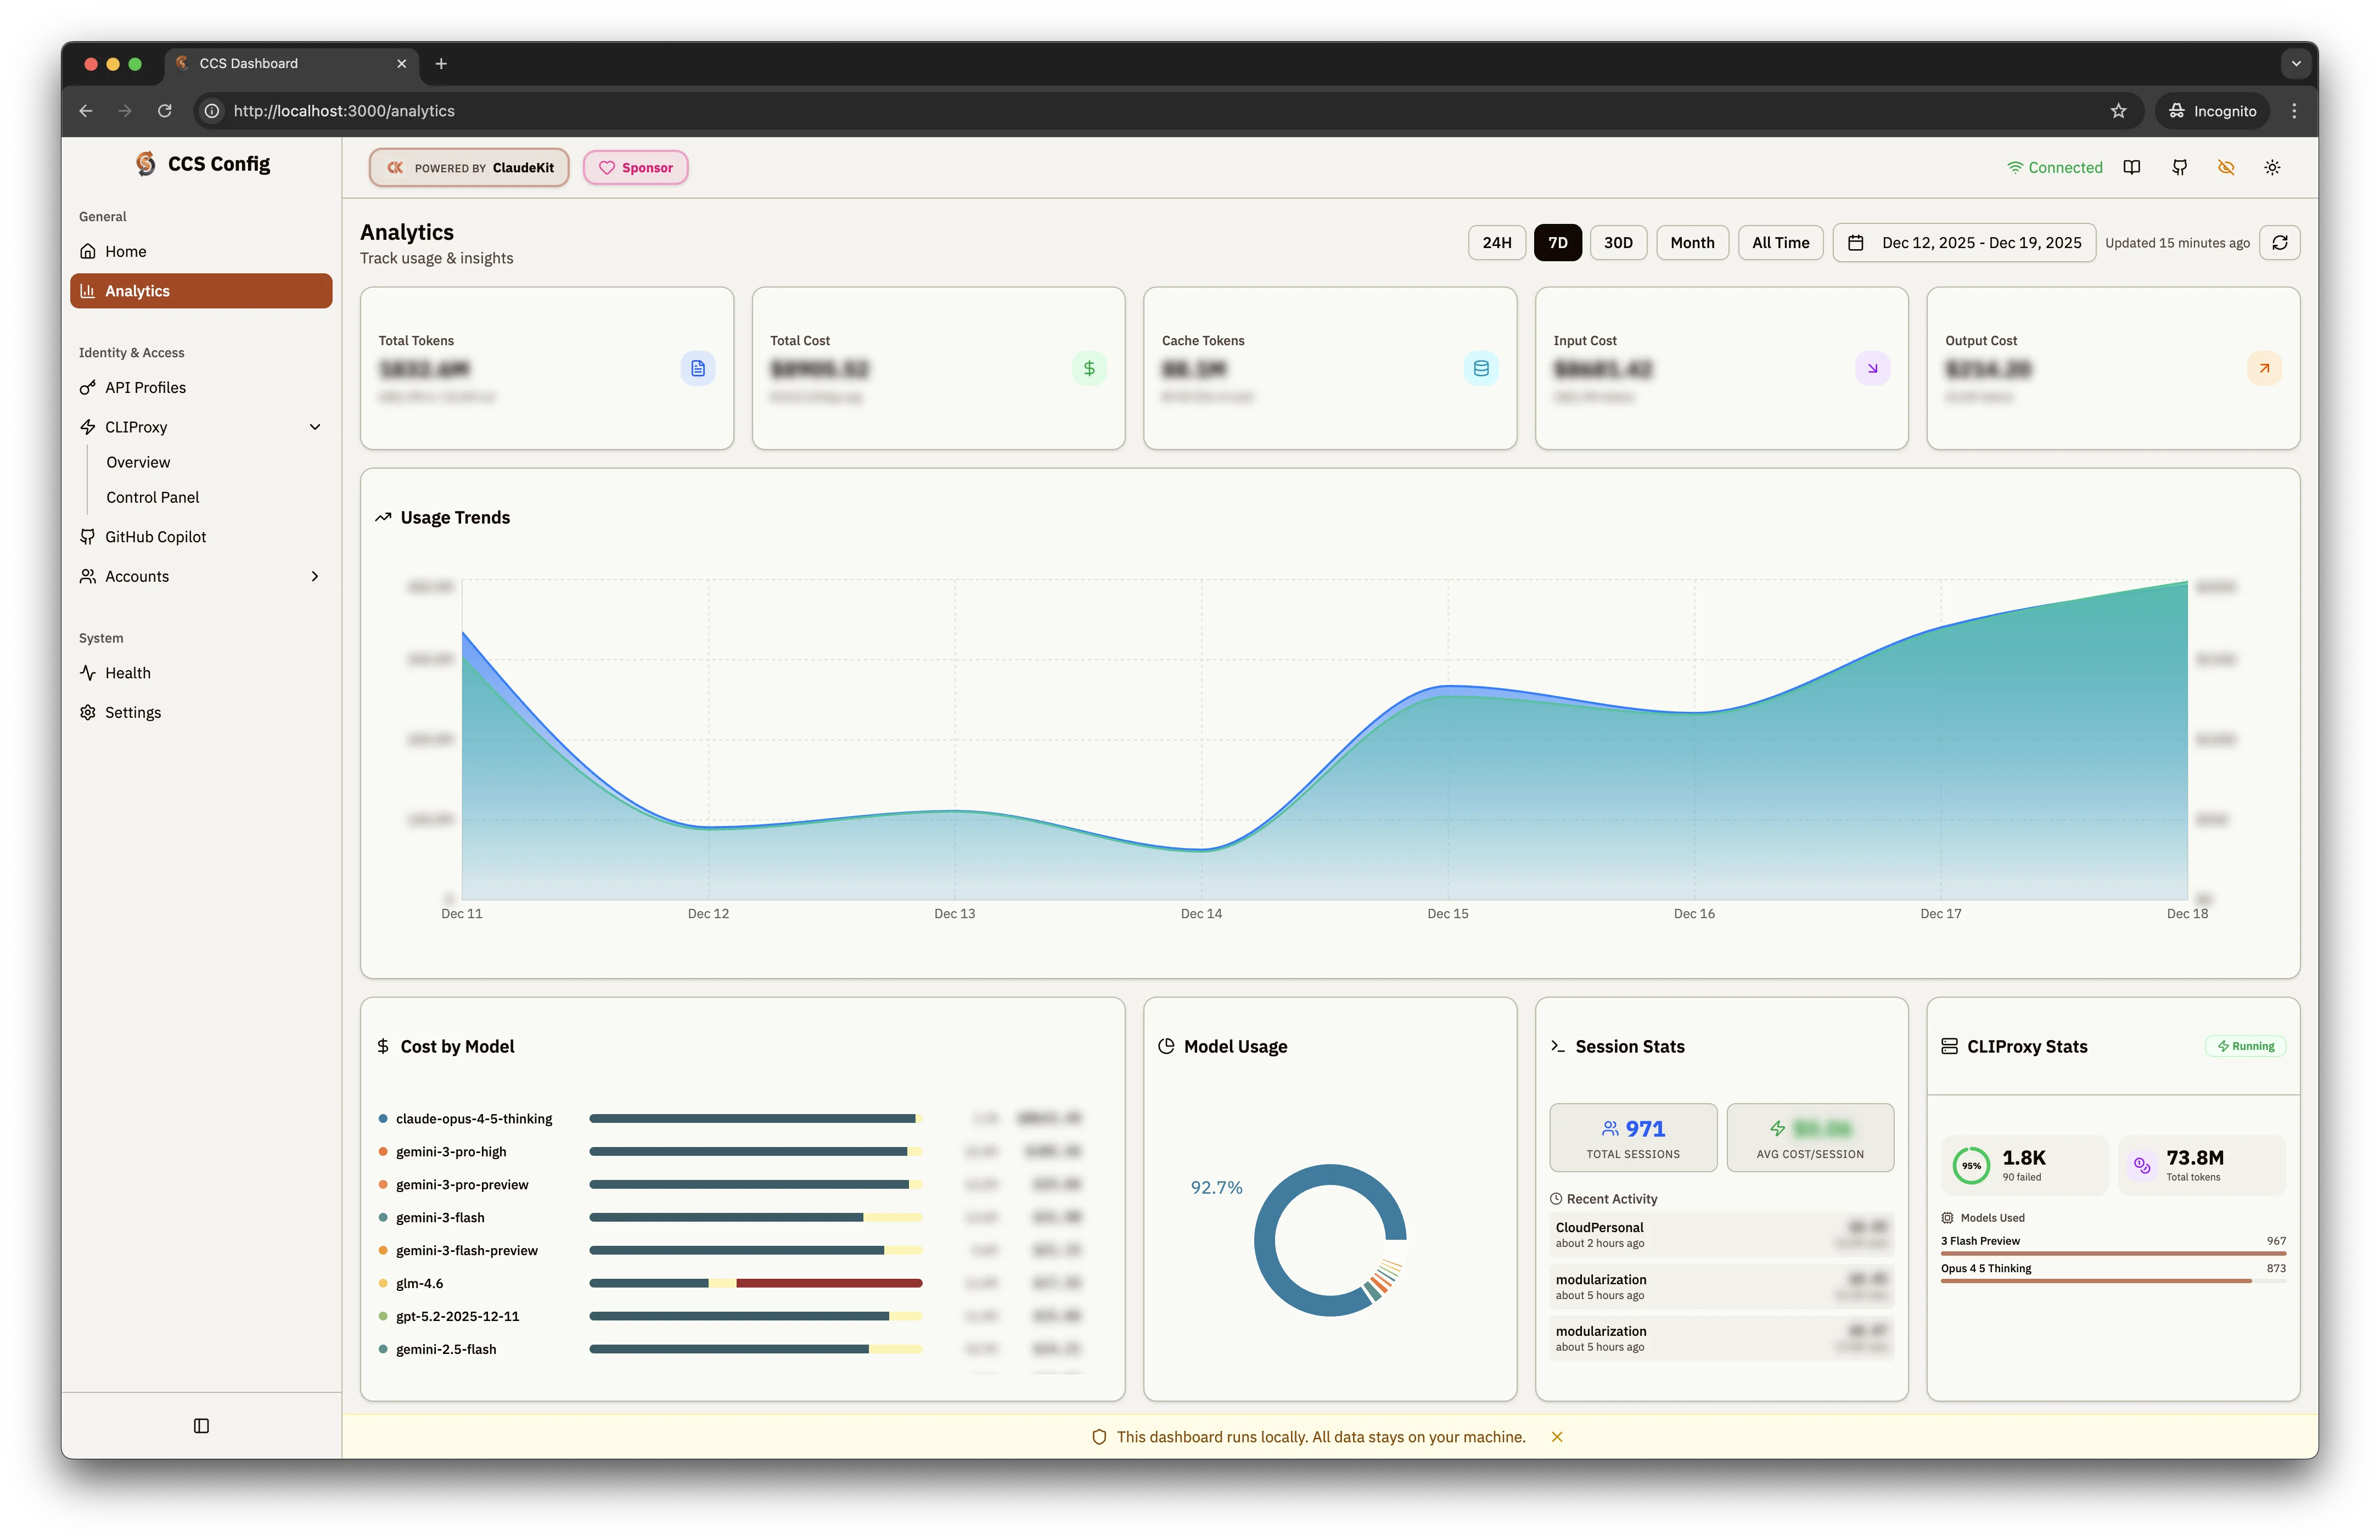
- Light Theme
Data Sources
Available since v7.51.0 — unified multi-provider analytics
Claude Config
Local session data from
~/.claude/ — costs, tokens, session history for Claude account profilesCCS Instances
Usage from all configured CCS profiles (GLM, API profiles, account profiles)
CLIProxy Multi-Provider
Aggregated usage from all CLIProxy OAuth providers (Gemini, Codex, AGY, GHCP, Kimi, etc.)
CLIProxy Background Sync
CLIProxy usage data syncs automatically every 5 minutes in the background:- Snapshot stored at
~/.ccs/cache/cliproxy-usage/latest.json - Dashboard reads from snapshot for instant load (no blocking API calls)
- Manual refresh available via the refresh button or API endpoint
Key Metrics
Five summary cards display high-level metrics:Total Tokens
Combined input/output tokens across all providers
Total Cost
Aggregate spending across Claude, Gemini, GPT, GLM, Qwen models
Cache Tokens
Tokens served from cache, reducing API costs
Input/Output Cost
Breakdown of costs by request direction
Dashboard Widgets
Usage Trends
Area chart showing token/cost trends over time with:- Configurable date ranges: 24H, 7D, 30D, Month, All Time
- Custom date picker for specific periods
- Auto-refresh with “Updated X ago” indicator
- Daily and hourly granularity — drill down to per-hour breakdowns
Cost by Model
Horizontal bar chart breaking down costs per model:- Claude Opus/Sonnet 4.6 Thinking
- Gemini 3 Pro / Flash variants
- GPT 5.2, GLM 4, Qwen3 Coder
- Color-coded bars for quick comparison
Model Usage
Donut chart showing distribution of requests across models:- Percentage breakdown by model
- Visual representation of dominant providers
- Monthly aggregates for billing overview
Session Stats
- Total Sessions: Count of coding sessions
- Avg Cost/Session: Average spending per session
- Recent Activity: List of recent sessions with timestamps
CLIProxy Stats
Real-time proxy performance metrics:- Success Rate: Percentage with total/failed counts
- Total Tokens: Aggregate tokens through proxy
- Models Used: Per-model breakdown with request counts
- Anomaly Detection: Highlights unusual usage spikes or error rates
Hourly Breakdown
Available since v7.51.0
- Token and cost breakdown by hour of day
- Identify peak usage patterns
- Useful for rate limit planning
Time Range Controls
| Range | Description |
|---|---|
| 24H | Last 24 hours |
| 7D | Last 7 days (default) |
| 30D | Last 30 days |
| Month | Current calendar month |
| All Time | Complete history |
| Custom | Date picker for specific range |
API Endpoints
Available since v7.51.0 — programmatic access to analytics data
http://localhost:3000:
| Endpoint | Method | Description |
|---|---|---|
/api/usage/summary | GET | High-level aggregate totals |
/api/usage/daily | GET | Day-by-day breakdown |
/api/usage/hourly | GET | Hour-by-hour breakdown |
/api/usage/models | GET | Per-model usage and costs |
/api/usage/sessions | GET | Session list with stats |
/api/usage/insights | GET | Anomaly detection results |
/api/usage/refresh | POST | Trigger manual CLIProxy sync |
Storage
Analytics data is stored locally. No data is sent to external servers.
| Path | Description |
|---|---|
~/.ccs/usage/ | Local session usage data |
~/.ccs/cache/cliproxy-usage/latest.json | CLIProxy usage snapshot (refreshed every 5 min) |